We help TPAs adopt AI

QA that reads every closed file. Not the 5% you sample.

Manual claims QA takes weeks, costs $35–125 a file, and still leaves most of the book unread. Varkle scores every closed claim against your own QA questionnaire — in minutes, to the same standard each time — and shows you where handling is falling short.
Book an intro call

Workers’ comp · auto · commercial & homeowners property · flood  —  Duck Creek, Guidewire or a flat-file export

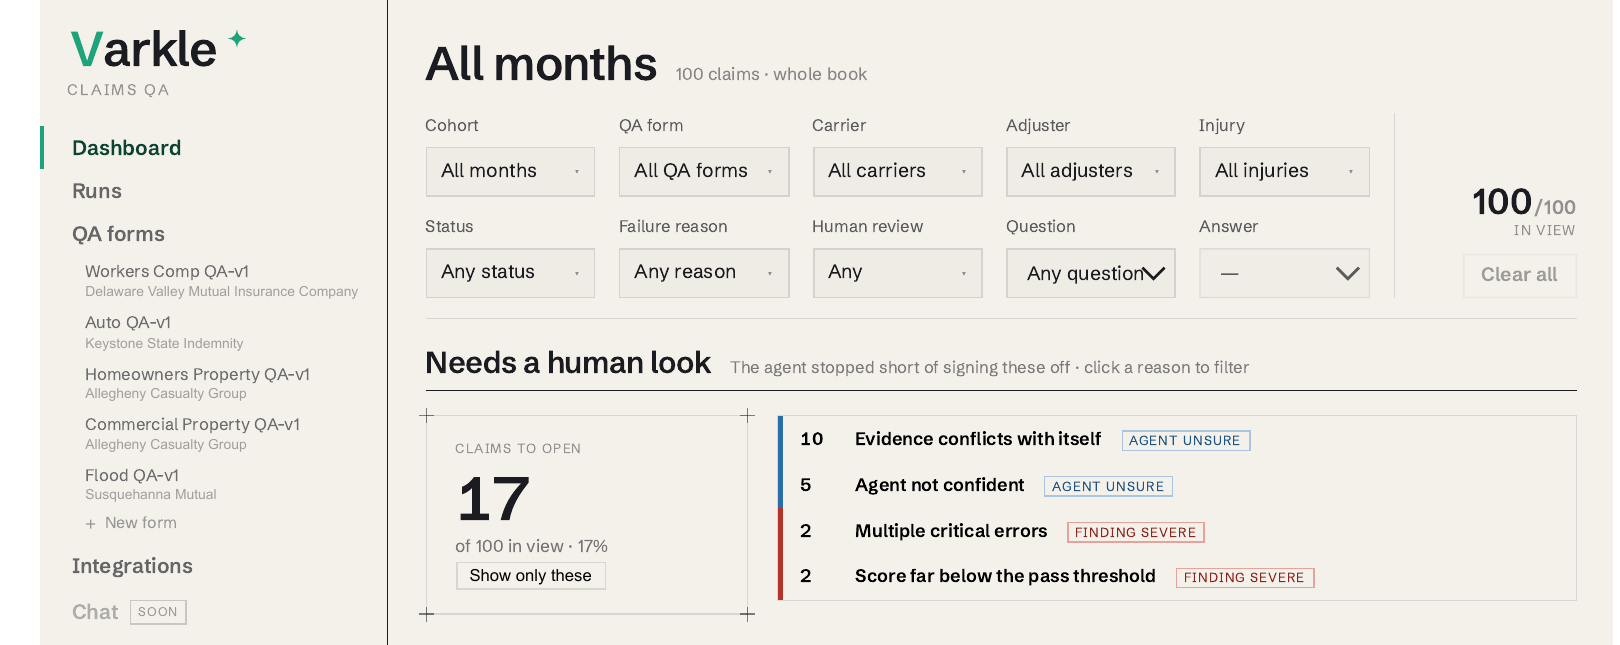
Fig. 01 — QA dashboardDemo account · sample data
The Varkle Claims QA dashboard: filters across cohort, QA form, carrier, adjuster and injury, and a Needs a human look panel showing 17 of 100 claims held back for review.
Coverage
100%

of closed files scored, against a ~5% manual sample

Turnaround
Minutes

to score the whole book, not weeks per sample

Manual cost
$35–125

per file, what a human review runs today

Consistency
1 standard

applied to every file, with no reviewer drift

Case study — a property TPA, several carriers, ~4,500 files a year

What changes when nothing is sampled.

Manual QAWith Varkle
MethodReviewer opens the fileScored automatically
CoverageUnder 5% of closed filesEvery closed file
TurnaroundWeeks per sampleMinutes per run
ConsistencyVaries by reviewer and by weekOne questionnaire, applied the same way
Cost per file$35–125Flat, whatever the volume
4,500

files read a year on the same book, instead of the ~225 a 5% sample reaches. The other 4,275 stop being invisible.

Findings

Ranked gaps in plain English, not a pile of flags.

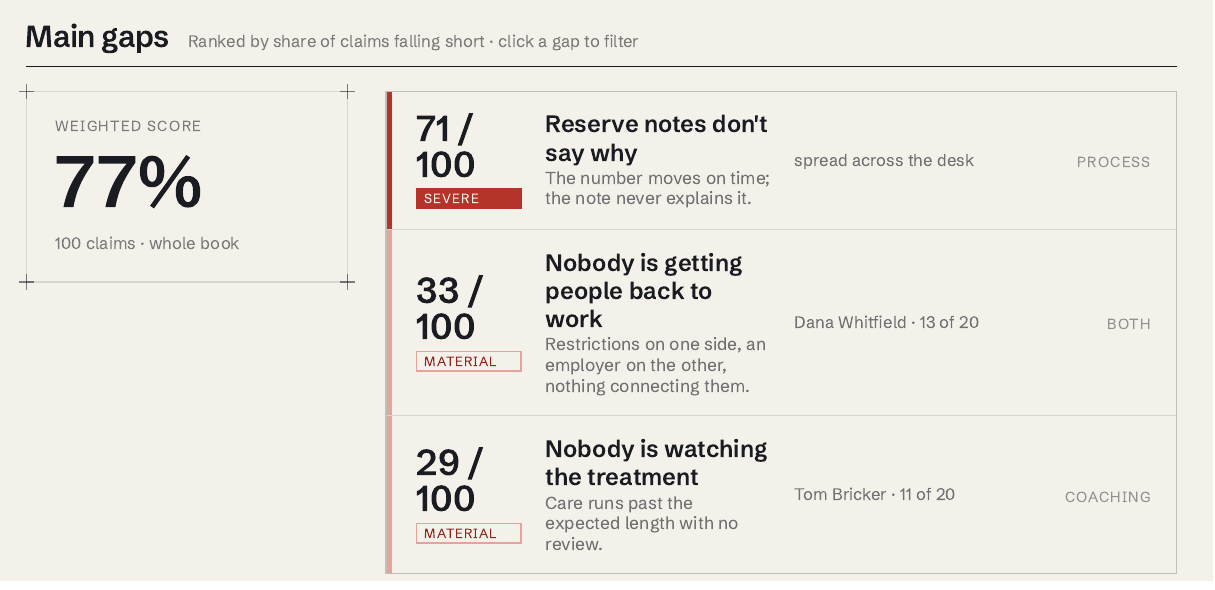
Each gap is scored by how much of the book it affects, described the way a claims manager would describe it, and tagged as a process problem, a coaching problem, or both.

Fig. 02 — Main gapsDemo account · sample data
Main gaps panel: a 77% weighted score across 100 claims, with ranked findings including Reserve notes don't say why, marked severe and process-level.

Where the failures concentrate

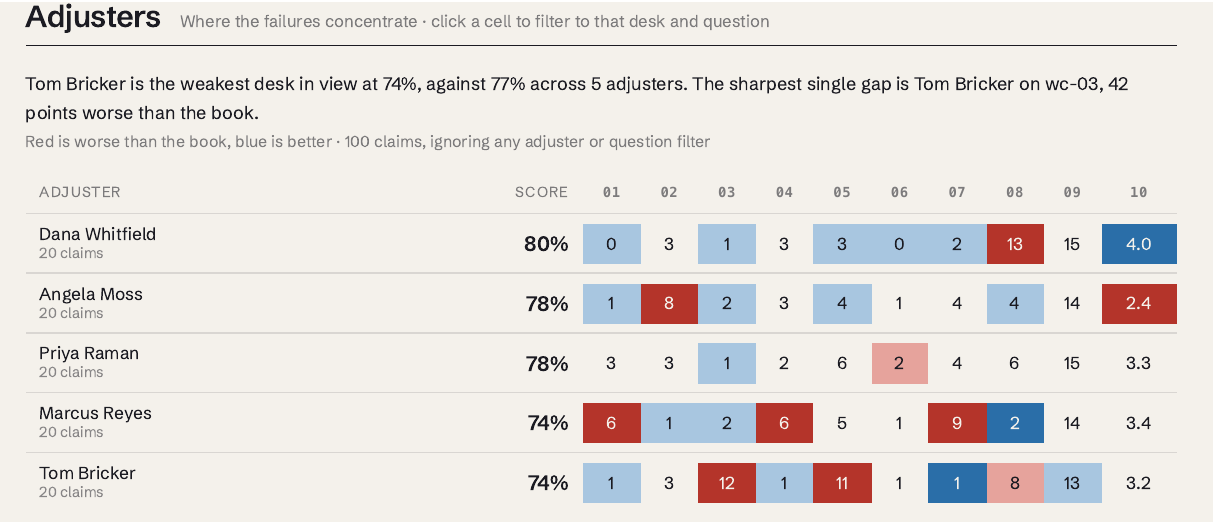
Fig. 03 — Adjuster scores by questionRed worse than book · blue better
Adjuster heatmap scoring five adjusters across ten QA questions, red where worse than the book average and blue where better.
Timing

Every commitment measured against the rule that actually applies.

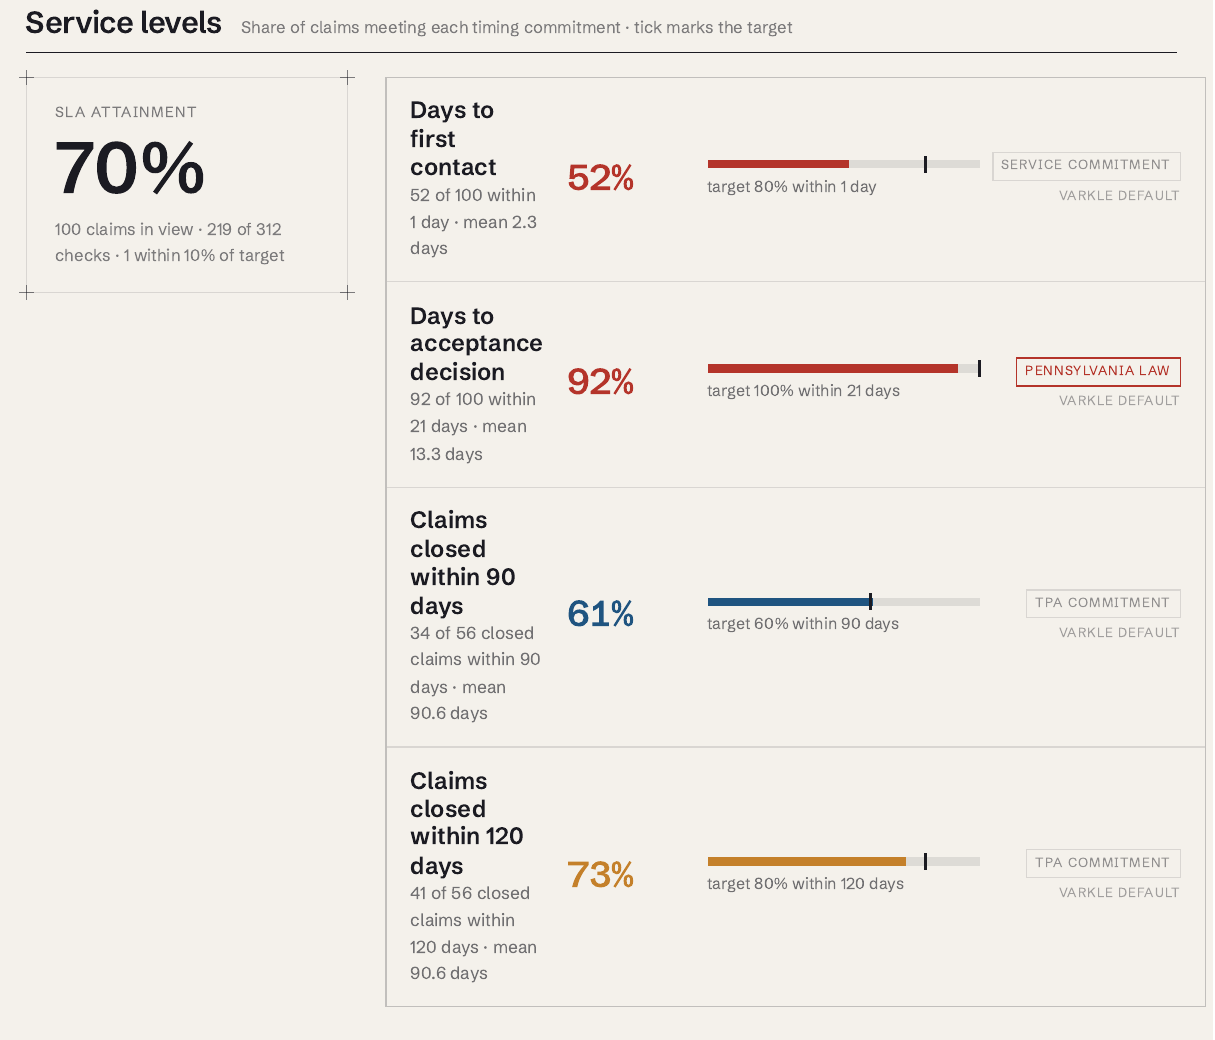
First contact, acceptance decisions, days to close — checked on every file against the statutory deadline in that jurisdiction and against the commitments you made to your client, rather than a generic benchmark.

Fig. 04 — Service levelsDemo account · sample data
Service levels panel: 70% SLA attainment, with per-commitment bars for days to first contact, acceptance decision within 21 days under Pennsylvania law, and claims closed within 90 and 120 days.
Human review

It tells you when it isn’t sure.

The agent signs off what it can stand behind and stops on the rest — evidence that conflicts with itself, low confidence, multiple critical errors, a score far below the pass threshold. Your reviewers open those files knowing the reason before they start.

17/100

held back for a human in the demo book above. The other 83 were signed off, each against the same questionnaire.

Integration & workflow

How it runs.

Step 01
Claims import
Direct integration to Duck Creek or Guidewire, or a flat-file export. Nothing for your team to build or maintain.
Step 02
Scoring
Every closed file scored against your own QA questionnaire — yours, not a generic one.
Step 03
Dashboard
A report file, plus queries and analysis by carrier, adjuster and root cause.
Next step

See what QA on your whole book turns up.

A short call — whether it’s a fit, and what a first run on your own closed claims would look like. No slides.

Book an intro call